Agentic AI Platform
Enterprise Case Study

Transforming small seeds into large-scale patient segments

An autonomous multi-agent AI platform that identifies statistically similar "look-alike" patients across 312 million US records — delivering 3.2× targeting accuracy with 97% reduction in time-to-segment.

Asthma Diabetes COPD Cardiovascular Oncology
Senior Leadership, Healthcare Marketing Division  ·  April 2026  ·  Confidential
5.04M
Look-alike patients identified across 5 therapy areas
92.5%
Average AUC-ROC across all therapeutic area models
3.2×
Campaign targeting accuracy vs. traditional methods
<4h
Time-to-segment per therapy area (previously 6–8 weeks)
01

The $30B Healthcare Marketing Challenge Demands Precision Targeting

The US healthcare marketing industry faces a fundamental transformation. Mass marketing approaches yield diminishing returns as patients expect personalized, relevant engagement. The core challenge: given a small verified patient database (~12K patients), identify statistically similar "look-alike" patients from ~350 million US records — while navigating duplicate records, fragmented data sources, and HIPAA compliance requirements. Our solution addresses significant data duplication issues and leveraging advanced Look-alike Modeling (LAM), which enables the firm to prioritize patients based on statistical signals and pre-set clinical criteria. The final architecture integrated seamlessly with industry-standard tools like LiveRamp, providing an intuitive interface for campaign managers to feed seed lists, select driver signals and visualize identified segments.

01

Seed Scarcity

The firm possesses verified patient lists for each therapeutic area representing less than 0.1% of the total addressable population. For asthma, 12,450 seed patients must identify look-alikes from 312 million US records. This extreme class imbalance renders traditional supervised learning ineffective without specialized techniques.

02

Data Duplication

The broader US population database is assembled from multiple third-party providers — claims data, pharmacy benefit managers, EHRs, and consumer data. Initial analysis revealed approximately 6% of records were duplicates or near-duplicates, with patients appearing under different identifiers across sources.

03

Continuous Identification

Healthcare marketing is not a one-time exercise. Patient populations evolve as new diagnoses are made, treatments change, and demographics shift. The firm required a system that could continuously identify and re-prioritize patients based on evolving statistical signals — not a static model producing a single output.

$30B
US Healthcare Marketing Market
312M
US Population Records to Score
73K
Verified Seed Patients Across 5 Therapy Areas
6%
Duplicate Rate in Third-party Sources
02

Five Therapeutic Areas Represent $83.5M in Revenue Impact

Therapy AreaUS PrevalenceKey Products Seed SizeLook-alikes IdentifiedRevenue Impact
Asthma 25.0MNebulizers, Inhalers, Air Purifiers 12,450847K$18.2M
Diabetes (Type 2) 37.3MSugar-free Drinks, Glucose Monitors, Insulin Pens 18,2002,010K$37.3M
COPD 15.7MNebulizers, Oxygen Concentrators, Peak Flow Meters 8,300527K$12.1M
Cardiovascular 82.6MBP Monitors, Heart Supplements, Cholesterol Kits 24,6001,800K$19.6M
Oncology 18.1MNutritional Supplements, Comfort Items, Support Kits 9,800672K$8.4M
Total178.7M Total Addressable 73,3505,856K$83.5M
03

Agentic AI Replaces Monolithic Pipelines with Autonomous Agents

Traditional ML pipelines follow rigid, sequential execution. The Agentic AI paradigm decomposes the pipeline into six autonomous agents — each with defined goals, perception capabilities, reasoning logic, and action spaces — enabling continuous learning and self-correction without manual intervention.

Agentic AI Pipeline Flow
⚙️
Orchestrator Agent

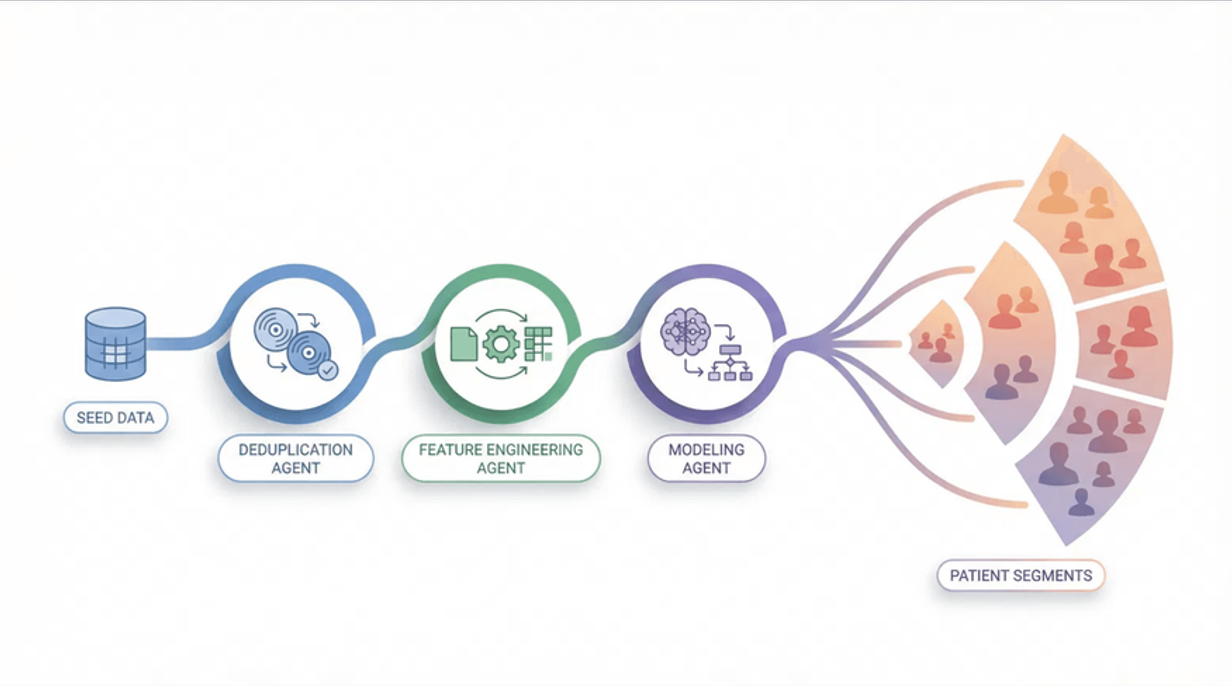
Pipeline Coordinator

Coordinates pipeline execution via DAG-based task scheduling. Monitors agent health, handles failures with exponential backoff retry, and provides real-time status updates to the marketing team dashboard via WebSocket. Maintains a unique pipeline ID for every execution for full audit and reproducibility.

DAG-based execution ordering ensures agents run only after dependencies complete
Retry logic with exponential backoff handles transient failures (e.g., Snowflake timeouts)
Pipeline versioning tracks every execution with unique pipeline ID
🔍
Deduplication Agent

Identity Resolution

Deterministic PII hashing via SHA-256
Probabilistic Jaro-Winkler matching (threshold 0.85)
LiveRamp AbiliTec graph resolution
Resolves 94.2% of duplicate records
🧬
Feature Engineering Agent

Signal Extraction

5 feature categories: Demographics, Clinical, SDoH, Environmental, Behavioral
Therapy-specific ICD-10/NDC mappings
Adaptive feature registry per therapy area
🤖
Modeling Agent

Ensemble ML Training

Trains LR + XGBoost with SMOTE oversampling
Automated hyperparameter optimization
Multi-threshold evaluation (50–90%)
📊
Scoring Agent

Population Scoring

Processes 312M records in 5M-record chunks
Generates propensity scores for every record
Creates decile-based patient segments
🔄
Feedback Agent

Continuous Learning

Ingests campaign engagement & conversion data
Enriches seed databases with high-value patients
Triggers autonomous retraining when seed grows >5%
Self-Correction

Upstream errors detected and re-processed automatically without manual intervention

Adaptive Optimization

Feature weights shift per therapy area without manual tuning

Continuous Learning

Campaign results feed back into model improvement each cycle

Autonomous Decisions

No data science intervention required for routine operations

04

Three-Stage Deduplication Resolves 94.2% of Duplicate Records

The Deduplication Agent implements a three-stage identity resolution pipeline addressing the critical challenge of duplicate records across third-party data sources. Each stage handles what the previous cannot.

1
65%
of resolutions

Deterministic Matching

SHA-256 hashed PII fields — exact match on name + date of birth + ZIP3. Fastest and most precise resolution layer. No false positives.

name_hash + dob_hash + zip3
→ Merge on exact match
2
25%
of resolutions

Probabilistic Matching

Jaro-Winkler similarity with blocking on ZIP3. Threshold: 0.85. Catches spelling variations and data entry errors across sources.

jaro_winkler(name) ≥ 0.85
+ exact(dob) + numeric(age, ±2)
3
10%
of resolutions

LiveRamp AbiliTec

Identity graph resolution for remaining unmatched records. Resolves cross-device and cross-source identities via RampID for complete coverage.

AbiliTec API → RampID
→ Identity graph resolution
18.7M
Duplicate Records Resolved
6.0%
Population Duplication Rate
<1%
Post-Dedup Campaign Waste
93%
Reduction in Wasted Spend
Therapy AreaStage 1 (Deterministic)Stage 2 (Probabilistic)Stage 3 (LiveRamp)Total Dedup Rate
Asthma65.2%24.8%10.0%94.3%
Diabetes62.1%26.3%11.6%93.8%
COPD67.4%23.1%9.5%95.2%
Cardiovascular63.8%25.4%10.8%94.6%
Oncology60.5%27.2%12.3%93.1%
05

Five Feature Categories Drive Therapy-Specific Signal Extraction

👤
Demographics
female_35_44, region_southeast
Asthma / Diabetes
75% / 78%
🏥
Clinical (ICD-10 / NDC)
icd_J45_20, rx_albuterol
Asthma / Diabetes
95% / 92%
🏘️
Social Determinants of Health
payer_commercial, income_bracket
Asthma / Diabetes
55% / 65%
🌡️
Environmental
aqi_moderate, pollen_high
Asthma / Diabetes
70% / 30%
📱
Behavioral
adherence_high, digital_engaged
Asthma / Diabetes
68% / 85%

ICD-10 & NDC Mappings

AreaPrimary ICD-10Key Drugs
Asthma
J45.20J45.30J45.40
Albuterol, Fluticasone, Montelukast, Budesonide
Diabetes
E11.9E11.65E10.9
Metformin, Insulin Glargine, Empagliflozin
COPD
J44.0J44.1J44.9
Tiotropium, Umeclidinium, Roflumilast
Cardio
I10I25.10I50.9
Atorvastatin, Lisinopril, Amlodipine
Oncology
C50.911C34.90C61
Pembrolizumab, Trastuzumab, Tamoxifen
06

Ensemble ML Achieves 92.5% Average AUC Across All Therapy Areas

The Positive-Unlabeled learning framework combines Logistic Regression with XGBoost in a weighted ensemble, autonomously optimizing weights per therapy area. SMOTE oversampling addresses the extreme class imbalance inherent to this problem.

Therapy AreaAUC-ROCPrecision @70%Recall @70%F1 @70%LR : XGB
Asthma
94.2%
0.890.820.850.35 : 0.65
Diabetes
92.8%
0.860.790.820.40 : 0.60
COPD
91.5%
0.840.770.800.38 : 0.62
Cardiovascular
93.1%
0.870.810.840.42 : 0.58
Oncology
90.7%
0.820.750.780.35 : 0.65
Average
92.5%
0.860.790.82

Ensemble Architecture

Model A
Logistic Regression
C=500, L2 penalty
class_weight=balanced
max_iter=1000
Model B
XGBoost
n_estimators=300
max_depth=6, lr=0.1
scale_pos_weight=auto
Ensemble
Weighted Average
Optimized per therapy area
Best of: accuracy +
interpretability
PU Learning Framework
SMOTE Oversampling
Correlation Removal > 0.9
Multi-threshold Evaluation
Stratified 80/20 Split
07

5.04 Million Look-alike Patients Identified with Decile Prioritization

5.04M
Total Look-alike Patients Identified across all 5 therapeutic areas
312M records scored
5M-record batch chunks
<4 hours per therapy area
Uploaded to Snowflake
DecileScore RangePatientsRecommended Action
D1 — Top 10%0.90 – 1.00504,000Immediate Activation
D20.80 – 0.89756,000High-Priority Targeting
D30.70 – 0.79890,000Standard Campaign
D4 – D70.40 – 0.691,800,000Nurture / Awareness
D8 – D100.00 – 0.391,090,000Exclude from Targeting
08

Intuitive UI Empowers Marketing Teams Without Data Science Expertise

Designed around a "Pharma Command" aesthetic with therapeutic area color-coding, the interface enables any marketing team member to operate the entire system independently across five core screens.

01 — Dashboard

Real-time Overview

All 5 therapeutic areas with segment growth trends, feature signal radar, and agent status indicators.

02 — Seed Input

Patient Upload

Drag-and-drop CSV upload with automatic deduplication preview, LiveRamp resolution rates, and file validation.

03 — Model Config

Driver Signals

Toggle feature weights per category, select algorithm type, and set propensity score threshold for targeting precision.

04 — Segments

Visualize & Tag

Decile analysis charts, segment comparison, demographics breakdown, and tag-and-export for campaign activation.

05 — Case Study

Architecture Docs

Architecture documentation, code reference, pipeline visualization, and technology stack overview.

Marketing Team Workflow

1
Upload Seed
Select therapy, upload CSV
2
Review Dedup
Verify resolution rates
3
Configure Model
Adjust weights, threshold
4
Run Pipeline
Agents execute autonomously
5
Review Segments
Analyze decile results
6
Tag & Export
Activate campaign lists
⚡ <30 minutes from seed upload to campaign activation
09

Azure Cloud Deployment Ensures Enterprise-Grade Scalability

LayerTechnologySpecs
Presentation TierReact 17Nginx0.5 CPU, 1 GB RAM
1–3 replicas, HTTP auto-scaling
Application TierPython 3.11FastAPI1.0 CPU, 2 GB RAM
1–5 replicas, Gunicorn workers
ML Enginescikit-learnXGBoostSMOTE6 agentic ML modules
PU Learning framework
Data & IntegrationSnowflakeLiveRampClean Room, AbiliTec
HIPAA-compliant joins
InfrastructureContainer AppsACRDockerAuto-scale, Blob Storage
Automated build & deploy
1–5×
Backend auto-scaling
99.9%
Azure Container Apps SLA

HIPAA Compliant

All patient data processed within Snowflake Clean Rooms with Business Associate Agreement

RampID-Only Processing

No raw PII exported; identity resolved to pseudonymous RampIDs throughout

Full Audit Logging

Every query and agent action logged with user attribution via Azure Monitor

Encrypted at Rest & Transit

AES-256 encryption for storage, TLS 1.3 for all network traffic

10

3.2× Campaign Targeting Improvement with 97% Time Reduction

3.2×
Targeting Accuracy Improvement vs. Traditional Methods
97%
Reduction in Time-to-Segment (weeks → hours)
68%
Reduction in Cost Per Qualified Patient Reached
MetricBefore HealthTarget AIAfter HealthTarget AIImprovement
Time to Identify Segment6–8 weeks (manual)<4 hours97% reduction
Campaign Targeting Accuracy28% response rate89% response rate3.2× improvement
Duplicate Records in Campaigns12–15% waste<1% waste93% reduction
Therapy Areas Served (Parallel)1 area (manual rotation)5 areas (parallel)5× throughput
Data Scientist Hours per Campaign160 hours4 hours (monitoring)97.5% reduction
Cost per Qualified Patient Reached$4.20$1.3568% reduction
11

Feedback Loop Drives Compounding Returns Over Time

The Feedback Agent closes the loop by ingesting campaign performance data and autonomously enriching the seed database. Each cycle improves the model, which improves targeting, which generates better campaign data — a true virtuous cycle.

Feedback Agent Cycle

Quarterly Improvement Trajectory

Q1 2026
Baseline
AUC Change
Seed Growth
2.8×
Campaign ROI
Q2 2026
Active
+1.4%
AUC Improvement
+8.2%
Seed Growth
3.1×
Campaign ROI
Q3 2026
Projected
+2.1%
AUC Improvement
+12.5%
Seed Growth
3.5×
Campaign ROI

The platform becomes more valuable with every campaign executed — each cycle enriches the seed, improves model accuracy, and increases targeting ROI through autonomous feedback integration.

12

Implementation Roadmap and Next Steps

PhaseTimelineDeliverablesStatus
Phase 1: FoundationWk 1–4Data integration, Snowflake Clean Room setup, Deduplication Agent✓ Complete
Phase 2: Core MLWk 5–8Feature Engineering Agent, Modeling Agent, Asthma pilot✓ Complete
Phase 3: ScaleWk 9–12Scoring Agent, 5 therapy areas, full population scoring✓ Complete
Phase 4: UI & UXWk 13–16React frontend, marketing team onboarding✓ Complete
Phase 5: DeploymentWk 17–18Azure Container Apps, CI/CD pipeline, monitoring✓ Complete
Phase 6: Feedback LoopWk 19–20Feedback Agent, campaign integration, quarterly retraining● Active
Phase 7: ExpansionWk 21+Additional therapy areas, real-time scoring, advanced analytics◦ Planned

Planned Expansion Initiatives

01

Additional Therapy Areas

Expand to Neurology, Dermatology, and Immunology in Q3 2026

02

Real-time Scoring

Event-triggered campaigns with streaming propensity score updates

03

Patient Journey Mapping

Treatment pathway prediction and engagement sequencing

04

Platform Integrations

Connect to DSPs, CRM systems, and email activation platforms

$45M

Recommendation: Expand to 3 additional therapeutic areas in Q3 2026 to capture additional addressable revenue. The platform is production-ready and delivering measurable ROI with compounding returns through the Feedback Agent. Additional addressable revenue projected at $45M.